Market Reports · May 9, 2026 · WorthMap Team
Designer Salaries in Egypt: A 4-Year Tracking Study (2022–2026)
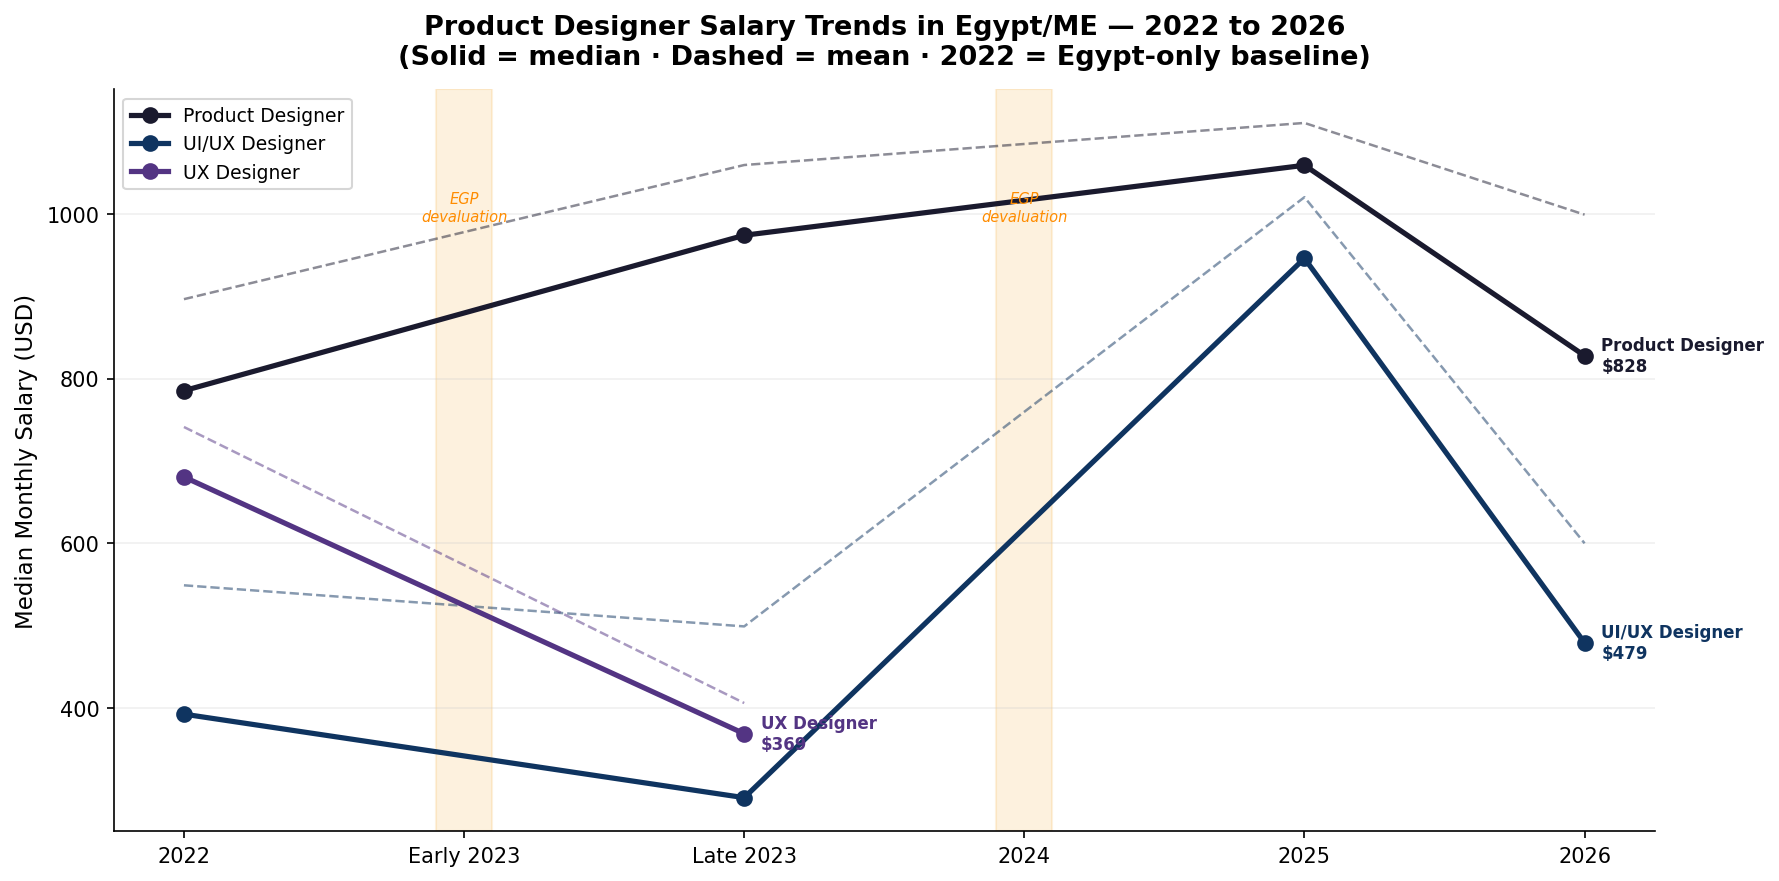
In late 2023, a junior UI/UX designer in Egypt was earning roughly 16% more in Egyptian pounds than two years earlier. On paper, that looked like progress. In purchasing power, it was a 28% pay cut — the pound had devalued so sharply that the nominal raise evaporated before it landed. That gap between what salaries look like and what they're actually worth is the central story of Egypt's design compensation market over the past four years.
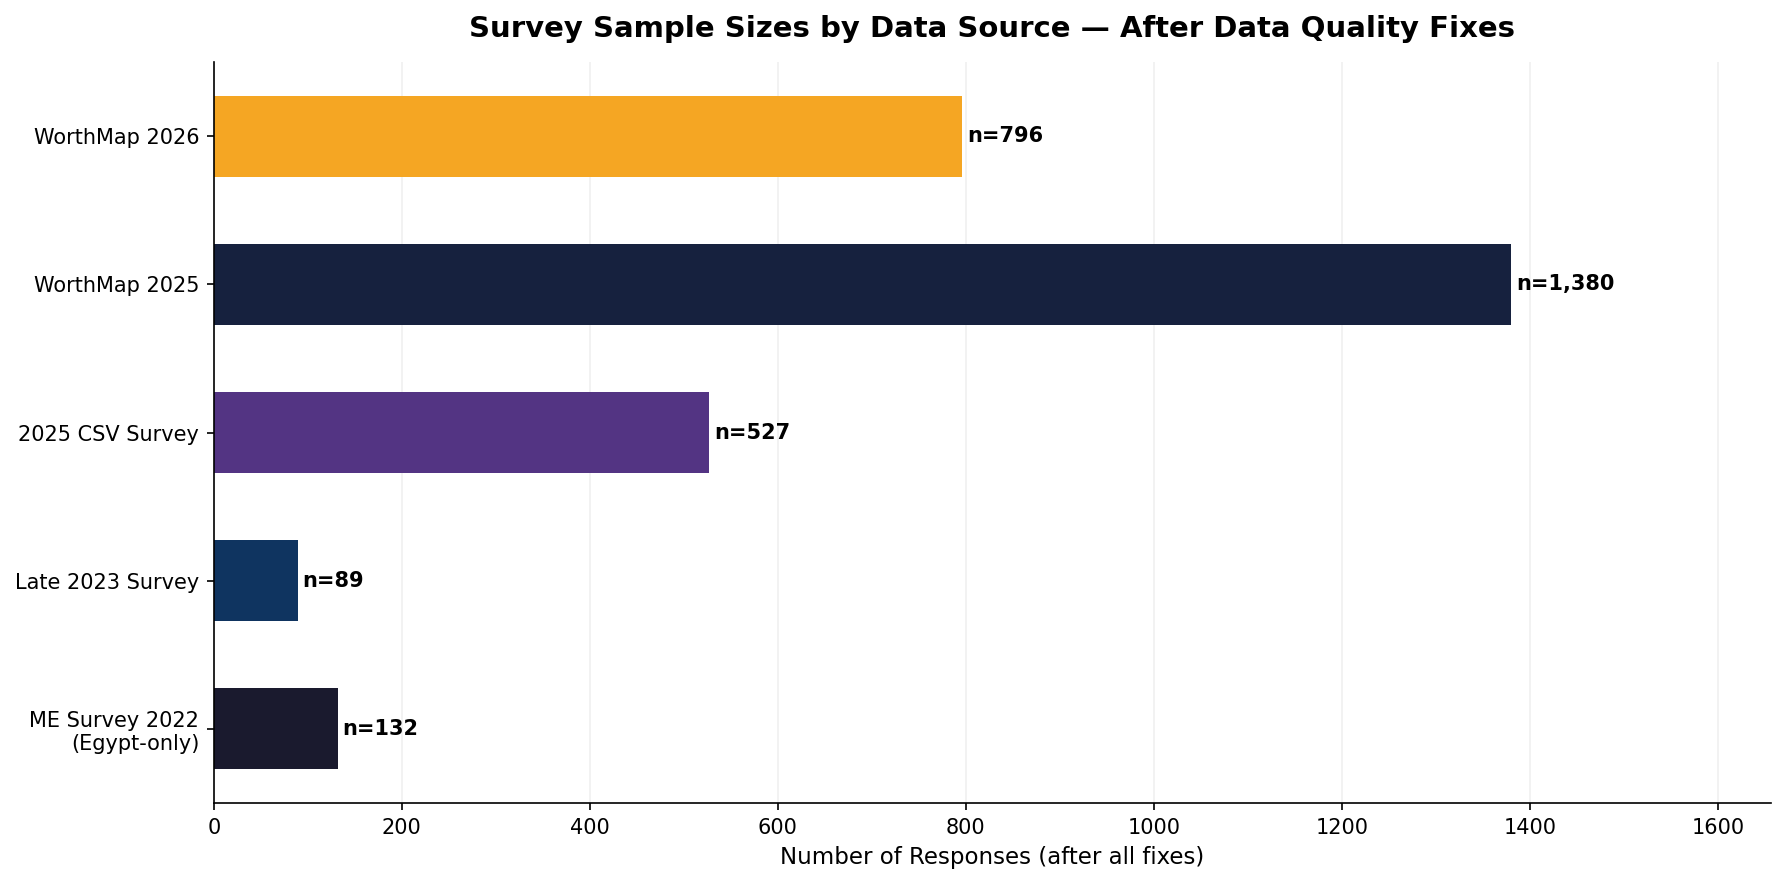
This article tracks designer salaries Egypt 2025 and back to 2022, drawing on four distinct data sources: a 2022 Middle East area survey, a dedicated late-2023 community survey, a 2025 USD-native community survey, and WorthMap's live verified database. Combined, those sources cover approximately 2,978 salary reports — enough to identify real structural trends, though not enough to treat every data point as a definitive benchmark. All figures use median salaries as the primary measure — more representative than averages for skewed salary distributions. Sample sizes are noted throughout where they matter.
The findings are not uniformly grim. Senior designers and those working for foreign companies have seen meaningful real gains. But the entry-level market, and a large portion of the mid-level market, has been running to stand still.
About the Data
Four sources feed this analysis. The 2022 Middle East area survey (n=135 Egypt-only, 176 total) was community-run and covered designers broadly across the region. A dedicated survey in September 2023 (n=89) captured a specific snapshot of the community at a moment of significant economic stress. The 2025 data comes from two sources: a USD-native community survey (n=527 after cleaning) and WorthMap's own verified database (n=1,380), which produces model-computed salary estimates based on user profile inputs. Early 2026 data (n=796, January through May) rounds out the picture.
All EGP figures are converted to USD at the prevailing interbank rate for each period: 19.1 in 2022, 30.9 in late 2023, 49.8 in 2025, and 50.5 in 2026. This makes cross-year comparisons meaningful in real purchasing power terms, not just nominal EGP growth. Where the two 2025 sources diverge, WorthMap's verified dataset is treated as primary.
Why not just use Glassdoor or PayScale?
We checked. Glassdoor returns zero usable data for Egyptian designers — their country routing maps Egypt queries to "Equatorial Guinea" and "Djibouti," both showing "No current reports." PayScale has some data, but the scale makes it hard to act on: 34 total salary profiles for UX Designer in Egypt (no level breakdown), and 18 for Product Designer — combined, fewer data points than WorthMap collects on a single role-level pair in a slow month. PayScale's median figures also don't distinguish local from offshore arrangements, collapsing the two markets that this article shows behave very differently. This gap is part of why WorthMap exists.
2022 Baseline: Where It All Started
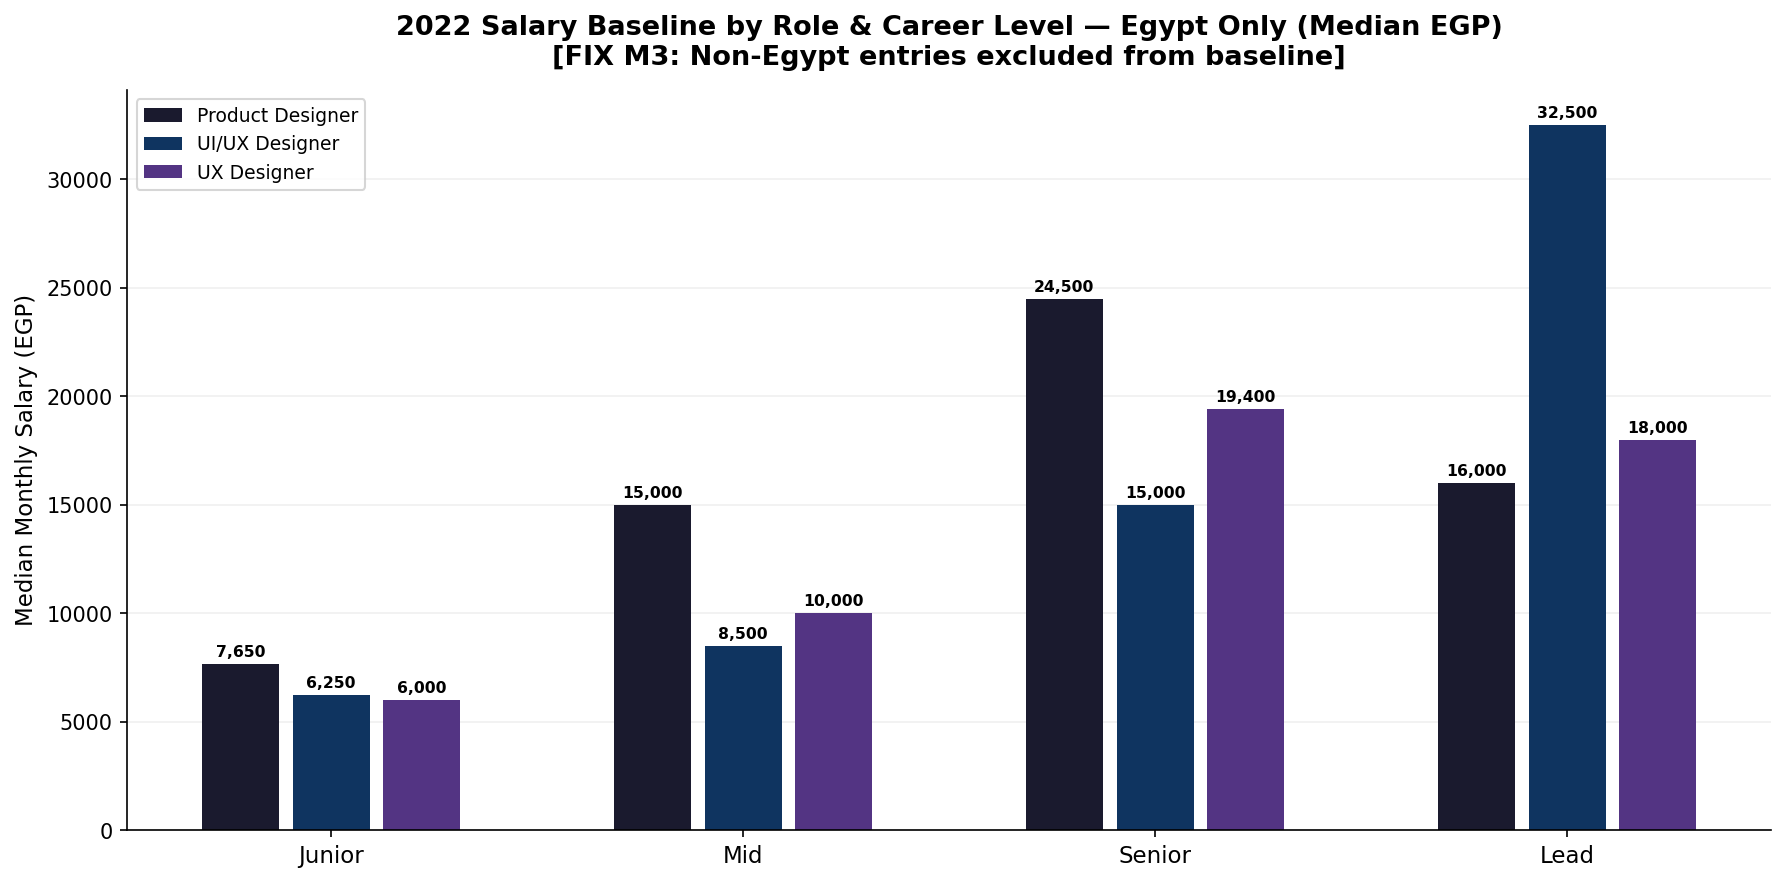
Egypt's design job market in 2022 looked quite different from today. Remote work for foreign companies existed but was a minority arrangement — most designers were employed locally, on EGP salaries, with the pound trading close to 19 to the dollar. This baseline filters to Egypt-only respondents (n=135 after removing 41 GCC-based entries). The market was dominated in sheer volume by the UI/UX Designer title: 46 junior UI/UX Designers appear in the Egypt-only 2022 dataset, compared to just 8 junior Product Designers (the latter being too few for a reliable benchmark — treat directionally).
| Role | Level | n | Median EGP | Median USD |
|---|---|---|---|---|
| Product Designer | Junior | 8 ⚠ | 7,650 | $401 |
| Product Designer | Mid | 8 ⚠ | 15,000 | $785 |
| Product Designer | Senior | 12 | 24,500 | $1,283 |
| UI/UX Designer | Junior | 46 | 6,250 | $327 |
| UI/UX Designer | Mid | 25 | 8,500 | $445 |
| UI/UX Designer | Senior | 12 | 15,000 | $785 |
| UI/UX Designer | Lead | 6 ⚠ | 32,500 | $1,702 |
⚠ = n < 10, treat as directional only. Egypt-only filter applied (41 GCC respondents excluded from baseline). EGP rate: 19.1/USD.
Product Designer was already commanding a premium over UI/UX Designer at every equivalent level. The senior-to-junior median ratio was 3.2× for Product Designers and 2.4× for UI/UX Designers. That ratio would look very different three years later.
2023: The Survey Year and the Devaluation Reality Check
The first half of 2023 produced no usable survey data — the Middle East area survey had essentially run its course, and no structured data collection filled the gap. Meanwhile, Egypt's pound began its descent: the EGP opened 2023 at roughly 24.7 to the dollar and continued weakening through the year.
The late 2023 community survey, fielded in September with 89 respondents, provides the clearest window onto what that period looked like on the ground.
| Role | Level | n | Median EGP | Median USD |
|---|---|---|---|---|
| Product Designer | Junior | 6 ⚠ | 18,500 | $599 |
| Product Designer | Mid | 11 | 24,000 | $777 |
| Product Designer | Senior | 9 ⚠ | 32,000 | $1,036 |
| UI/UX Designer | Junior | 22 | 7,250 | $235 |
| UI/UX Designer | Mid | 17 | 10,000 | $324 |
| UI/UX Designer | Senior | 10 | 16,750 | $542 |
⚠ = n < 10, treat as directional only. Medians shown. EGP rate: 30.9/USD.
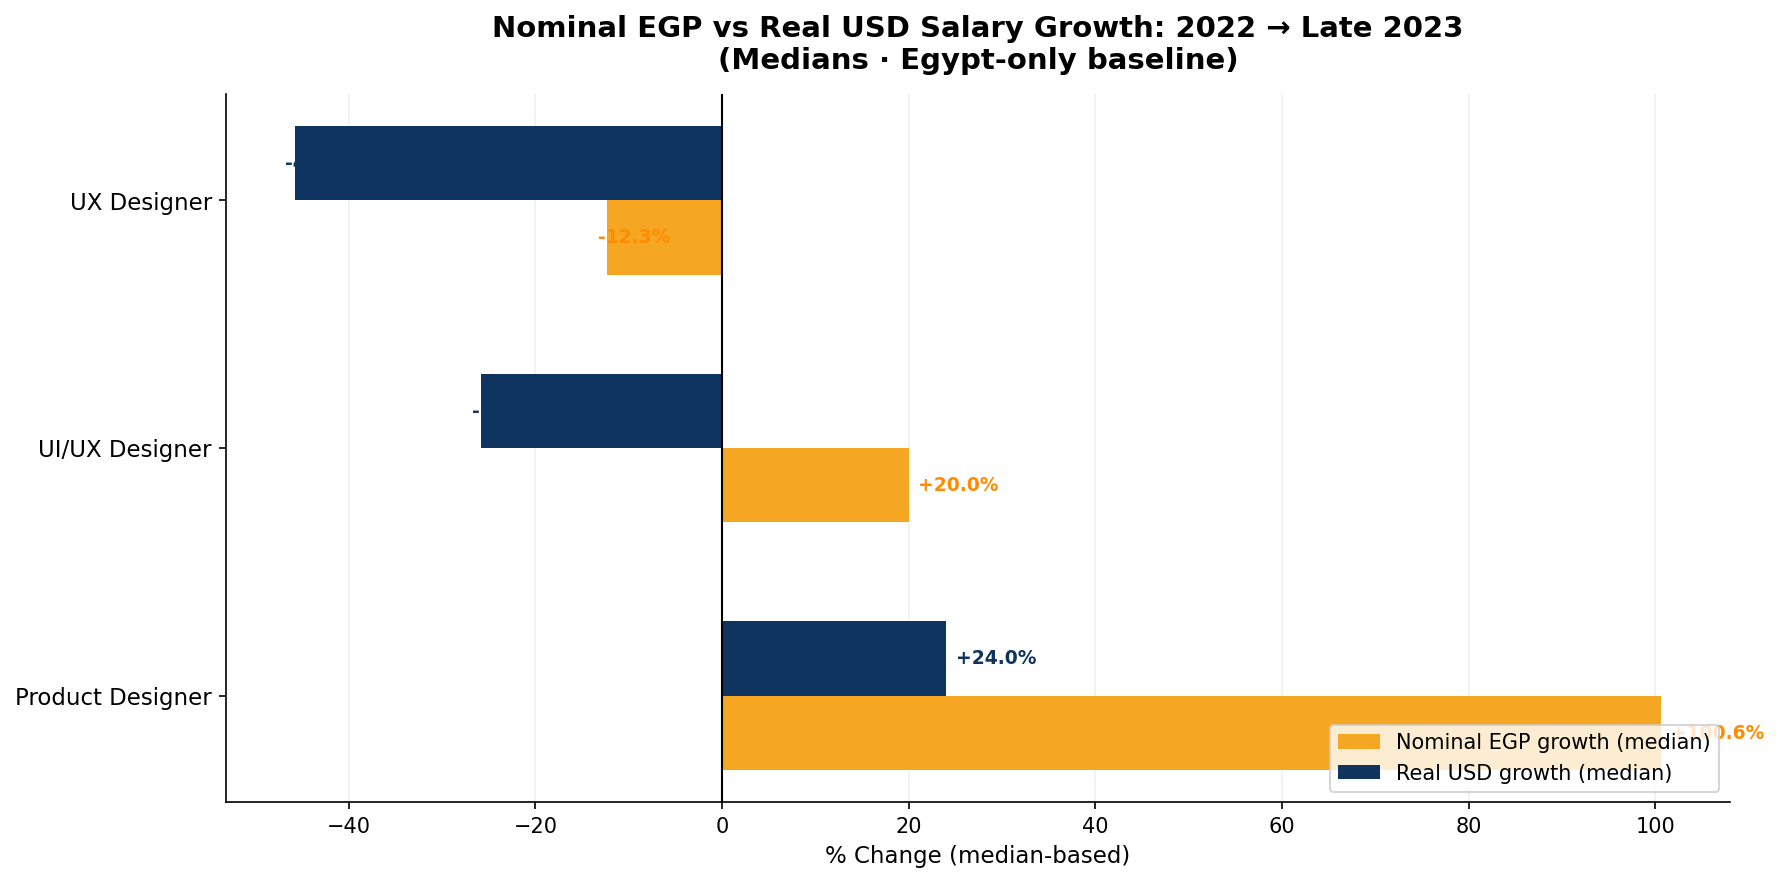
The EGP numbers look like raises. The USD column tells the actual story. A junior UI/UX designer's median salary was 7,250 EGP in late 2023 — $235/month at the then-current rate, down from $327/month in 2022 (Egypt-only baseline). That is a 28.3% real pay cut despite a nominal EGP increase of 16%.
Product Designers held up better. Mid-level Product Designers saw a nominal EGP median rise from 15,000 to 24,000 EGP (+60%), which translated to a modest real gain in USD ($785 → $777 — roughly even once you account for the devaluation). The Product Designer title was already more likely to attract offshore or hybrid arrangements in late 2023, which buffers the devaluation effect. The n values here are small (11 for Mid, 9 for Senior), so treat these figures as directional rather than definitive.
This is what Egypt's design community experienced during the devaluation period: paper raises that couldn't keep pace with macroeconomic reality — most acutely felt by the largest cohort, junior and mid-level UI/UX designers.
2024: The Missing Year
There is no structured survey data covering 2024 in this dataset. The late 2023 survey ended in September, and the next reliable collection is from 2025. That gap is real and worth acknowledging rather than glossing over.
What we know from context: March 2024 brought the most dramatic single EGP devaluation of the entire period, with the pound moving from roughly 31 to 47 against the dollar in a matter of weeks. The 2025 WorthMap data — which shows dramatically higher EGP salaries across all roles compared to the 2023 snapshot — implies that the market absorbed some of this shock through compensation adjustments. Whether those adjustments happened immediately in March 2024 or gradually through the second half of the year is not something this dataset can answer.
2025: The USD Shift
If 2023 was the year the devaluation hit designers hardest, 2025 is the year the market began to reorganise around it. The 2025 WorthMap dataset — 1,380 verified salary reports spanning Product Designers, UI/UX Designers, and UX Researchers — is the richest single source in this analysis, and what it shows is a market that has bifurcated.
Methodology note: WorthMap's 2025 figures are model-computed salary estimates produced by WorthMap's algorithm based on user profile inputs — not raw self-reported salaries. This is confirmed by the unique, non-round values in the underlying data (e.g. 14,654 · 32,908 · 91,520 EGP), characteristic of model output rather than manual entry. This does not invalidate the data — it is a valid benchmark representing what WorthMap estimates for users of each role/level profile — but it should be interpreted as such, not as a direct community survey.
| Role | Level | n | Median EGP | P25–P75 EGP | Median USD |
|---|---|---|---|---|---|
| Product Designer | Junior | 151 | 17,117 | 11,252 – 22,647 | $344 |
| Product Designer | Mid | 147 | 39,044 | 21,952 – 62,406 | $784 |
| Product Designer | Senior | 145 | 103,719 | 63,706 – 169,497 | $2,083 |
| UI/UX Designer | Junior | 155 | 14,654 | 9,964 – 22,032 | $294 |
| UI/UX Designer | Mid | 146 | 32,908 | 18,874 – 59,368 | $661 |
| UI/UX Designer | Senior | 160 | 91,520 | 58,508 – 148,740 | $1,838 |
| UX Researcher | Junior | 156 | 18,093 | 10,734 – 22,965 | $363 |
| UX Researcher | Mid | 158 | 29,894 † | 19,632 – 62,021 | $600 † |
| UX Researcher | Senior | 162 | 108,100 | 67,421 – 191,435 | $2,171 |
2025 WorthMap model-computed estimates. Median figures. † = right-skewed group (avg 25%+ above median). EGP rate: 49.8/USD.
Three things stand out. First, senior-level Product Designer ($2,083 median) and UX Researcher ($2,171 median) salaries have crossed into territory that looks competitive even by regional standards. Second, the interquartile range at senior level is enormous: a Senior Product Designer's middle 50% spans 63,706–169,497 EGP — that spread is almost entirely explained by employer type (local vs. offshore). Third, junior salaries in USD are actually below their 2022 equivalents — a junior UI/UX designer's $294 median in 2025 is lower than the $327 Egypt-only benchmark from 2022, a real loss even after three years of nominal EGP raises.
One methodological note on the two 2025 sources: the community survey (USD self-reported) and WorthMap's model estimates diverge meaningfully on some cells — most visibly UI/UX Mid, where the community survey shows a $338 median vs WorthMap's $661. This is expected: the community survey skews toward local-EGP respondents and lacks salary verification, while WorthMap's dataset covers a broader range of employer types including a higher proportion of offshore arrangements. The WorthMap figure is treated as primary throughout, but the gap itself is informative — it shows how much variance exists within any single role/level label depending on work arrangement.
The Offshore Premium
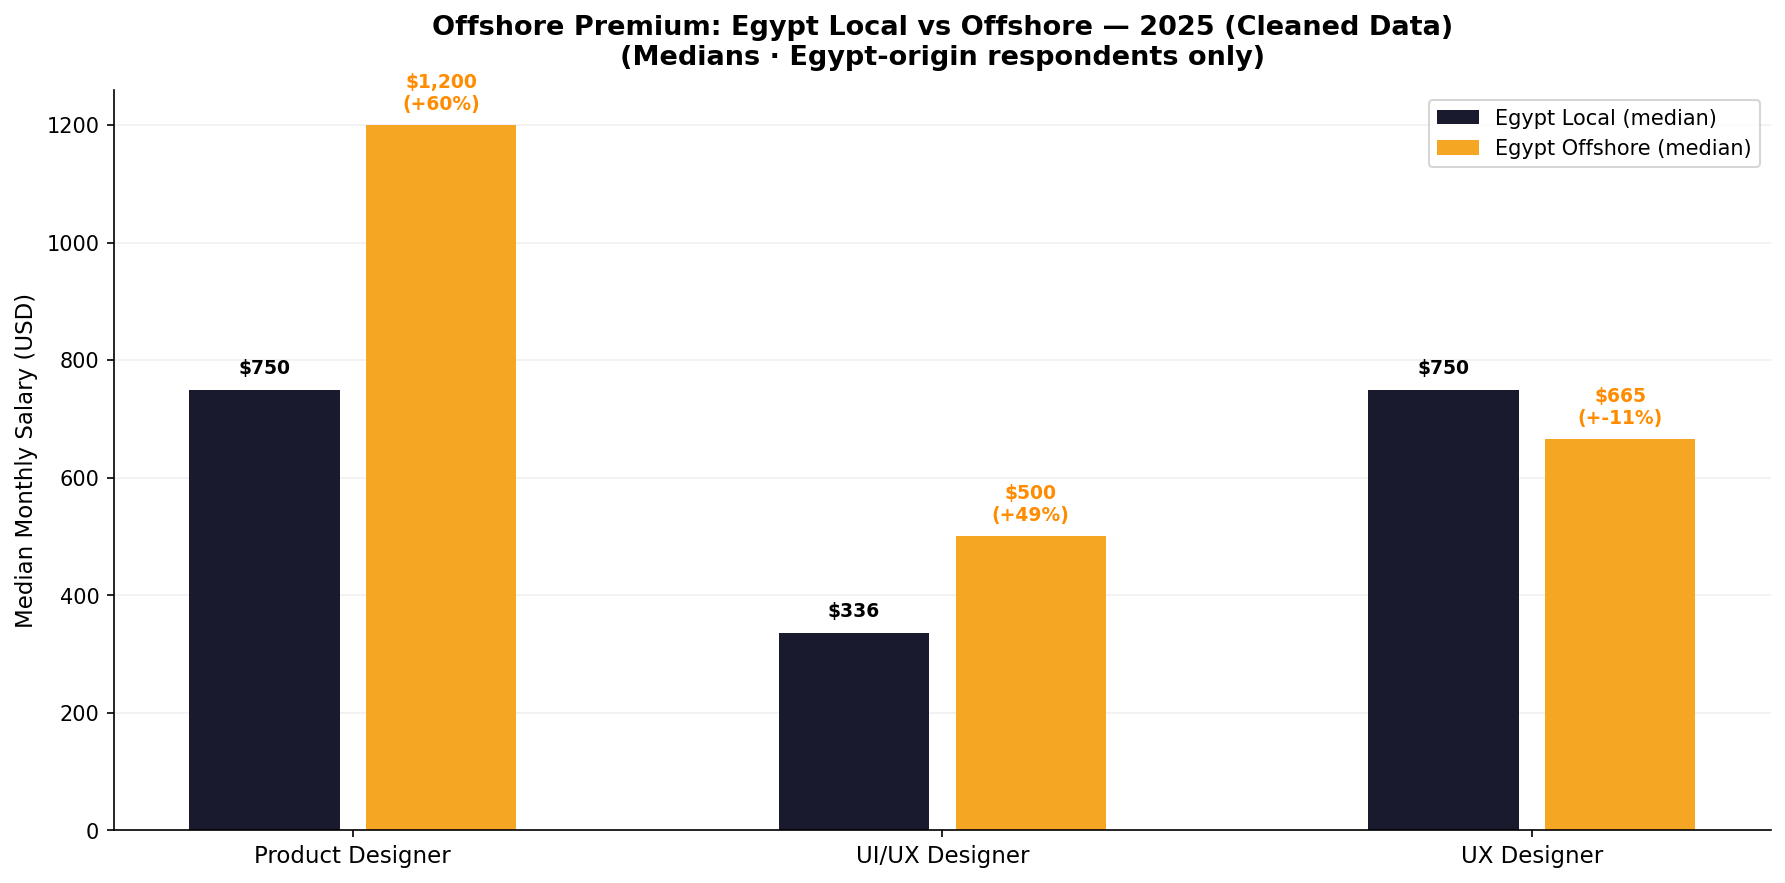
The 2025 community survey makes the bifurcation explicit. Among Egypt-based designers, those working for offshore companies — primarily Saudi Arabia (104 cases) and the UAE (26 cases) — earn dramatically more than their locally-employed peers.
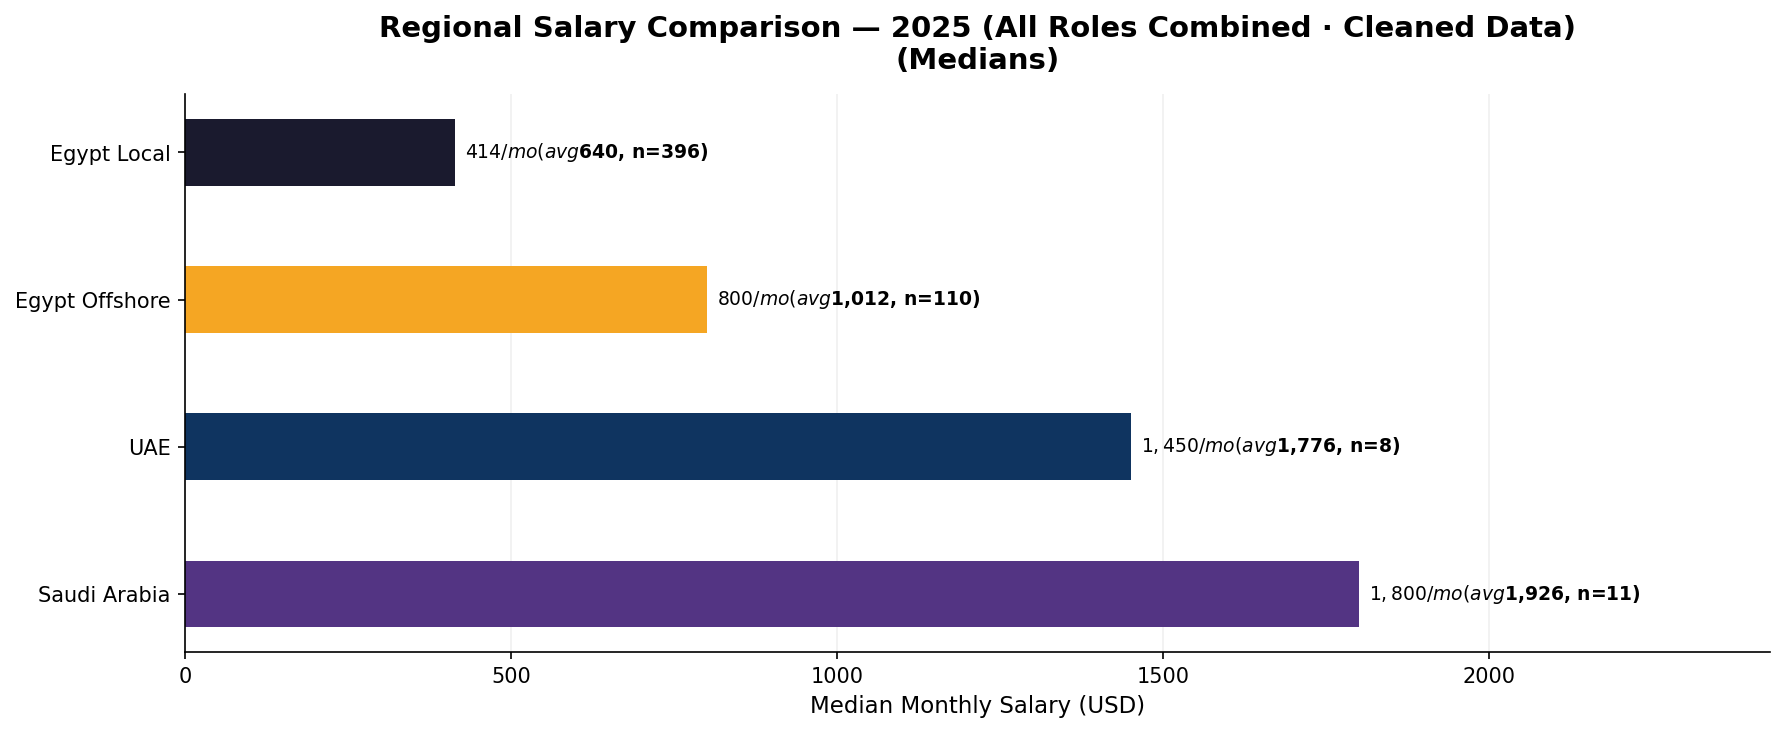
A 60% salary premium for Product Designers working for foreign companies is not a niche advantage — it represents a fundamentally different compensation reality. For UI/UX Designers the median premium is +49% ($500 offshore vs $336 local). Across all roles combined, the median gap is even larger: Egypt offshore designers earn $800/month versus $414/month for locally-employed peers — a 93% premium. The offshore track has moved from edge case to mainstream survival strategy for a significant segment of the UI/UX salary benchmark Egypt landscape.
The regional comparison reinforces this picture. Egypt local designers have a median of $414/month across all roles, while Egypt offshore sits at $800/month. Saudi Arabia-based designers show a median of $1,800/month and UAE $1,450/month — though with only 11 and 8 respondents respectively these should be read as directional, not as firm benchmarks.
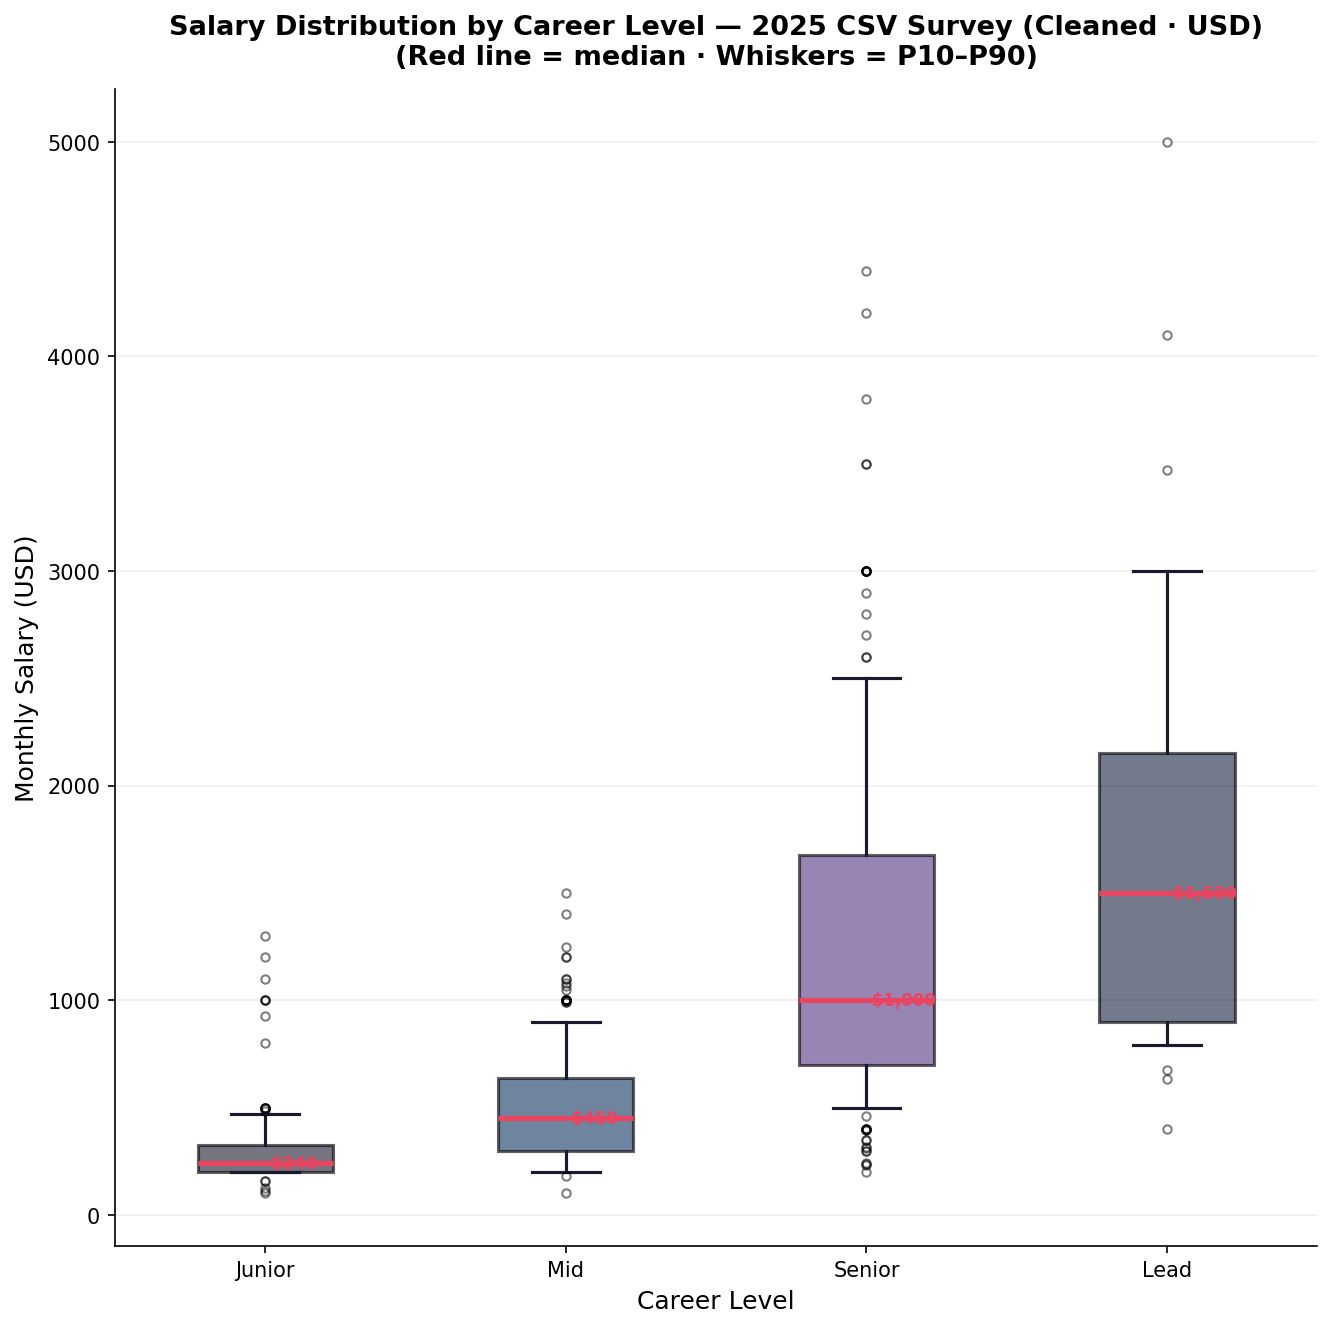
The spread within levels is also worth noting. Senior designers in the 2025 survey show a wide distribution — the difference between the 10th and 90th percentile for a Senior Product Designer spans over 100,000 EGP per month. Employer type explains most of that spread.
2026 Snapshot: Early Signals
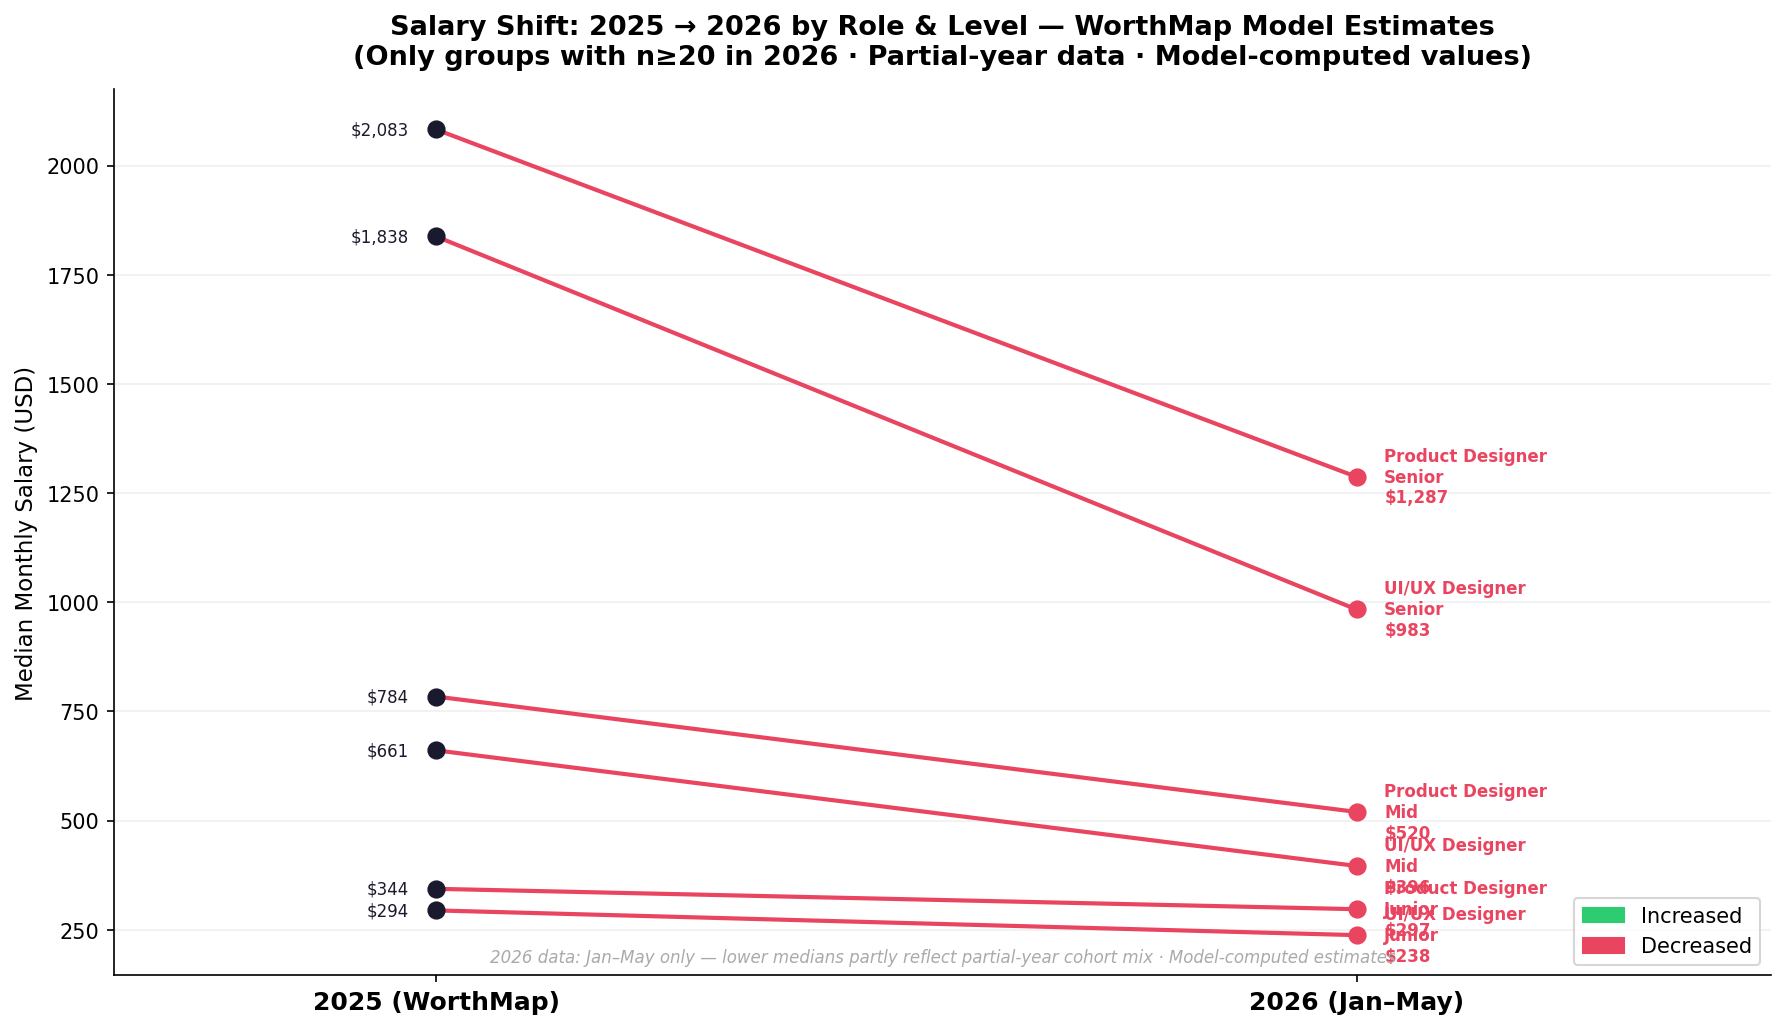
The 2026 data covers January through May only — 796 salary reports from WorthMap's live database. Partial-year data comes with a systematic bias: the first half of any year tends to over-represent junior and mid-level hires, since companies front-load entry-level recruitment and senior searches take longer to close.
| Role | Level | n | Median EGP | Median USD |
|---|---|---|---|---|
| Product Designer | Junior | 101 | 15,000 | $297 |
| Product Designer | Mid | 164 | 26,250 | $520 |
| Product Designer | Senior | 169 | 65,000 | $1,287 |
| Product Designer | Lead | 21 ⚠ | 130,000 | $2,574 |
| UI/UX Designer | Junior | 100 | 12,000 | $238 |
| UI/UX Designer | Mid | 79 | 20,000 | $396 |
| UI/UX Designer | Senior | 61 | 49,662 | $983 |
| UX Researcher | Junior | 36 | 17,936 | $355 |
| UX Researcher | Mid | 29 | 37,066 | $734 |
| UX Researcher | Senior | 29 | 110,147 | $2,181 |
2026 WorthMap data, January–May only. Median figures. ⚠ = interpret with caution. EGP rate: 50.5/USD.
Most 2026 medians sit below their full-year 2025 equivalents — the early-year hiring mix skews toward junior submissions, which compresses the numbers. The UX Researcher Senior median is the notable exception: $2,181 in 2026 vs $2,171 in 2025, effectively flat — suggesting that senior UXRs are a stable, less cyclically recruited cohort. The Lead-level Product Designer figure (n=21, median 130,000 EGP / $2,574) is the first year WorthMap has enough Lead-level data to report — treat it as a first signal, not a settled benchmark.
The Bigger Picture: What 4 Years Tell Us
Three structural findings emerge from this dataset, and they apply regardless of which specific role or level you occupy.
Nominal growth masked real decline — for most designers. Between 2022 and late 2023, EGP salaries went up across the board. But the pound devalued faster than employers adjusted compensation. Junior and mid-level UI/UX salary benchmark Egypt median figures in USD terms are lower in 2025 than they were in 2022 for locally-employed designers ($294 vs $314 for UI/UX Junior). Only senior-level roles and those on offshore or USD-indexed arrangements came out materially ahead in real purchasing power terms over the full four-year span.
Seniority now commands a structural premium that didn't exist four years ago. In 2022, a Senior Product Designer's median salary was roughly 3.2× a Junior's; for UI/UX it was 2.4×. By 2025, those ratios had risen to 6.1× and 5.6× respectively, with UX Researcher showing a 6.0× gap. This is not simply about senior salaries rising — it's about junior salaries failing to recover their real value while senior compensation, often tied to offshore demand, has accelerated sharply.
There are now two distinct markets operating under one industry label. Designers working for Egyptian companies in EGP are operating in a local-EGP market where compensation is slowly recovering from the devaluation shocks of 2023 and 2024. Designers working for Saudi or UAE-based companies — remotely, from Egypt — are operating in what is effectively a regional USD market, with all the pricing power that comes with it. These two tracks are diverging structurally, not just temporarily.
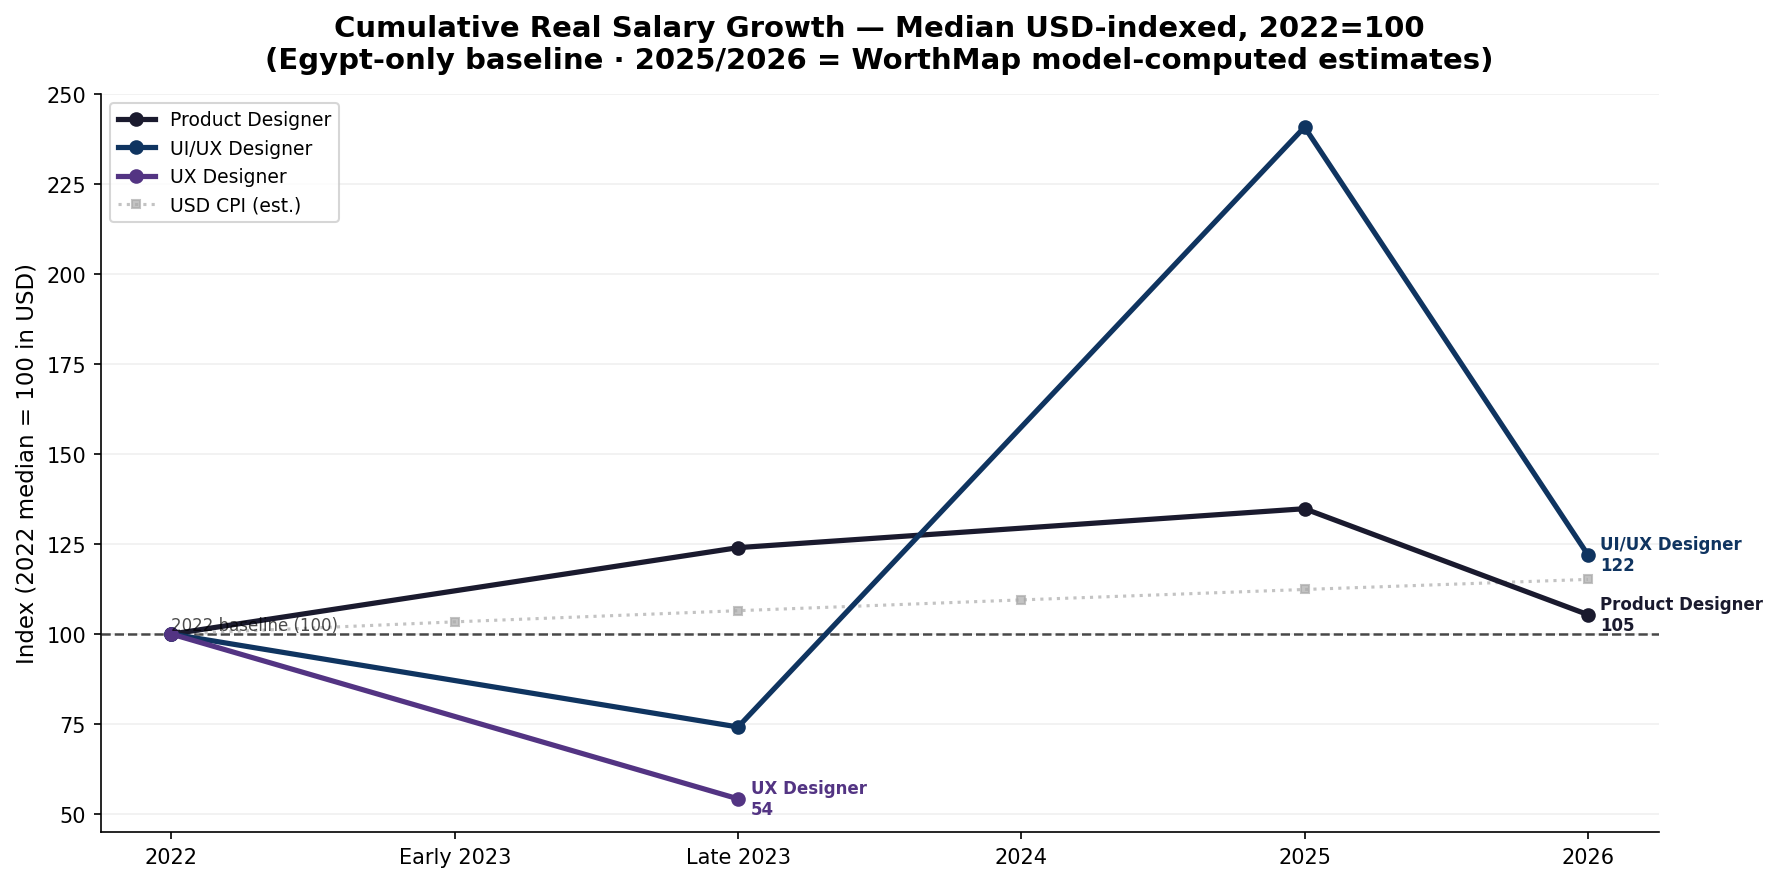
Looking ahead — without attempting predictions — a few observations are worth noting. AI tooling is compressing the production layer of design work, and that pressure tends to fall disproportionately on junior and mid-level roles. Saudi Arabia appears to be growing as the primary destination for Egypt-based offshore design work. And the EGP stabilisation through 2025 into 2026 — the rate has moved from 49.8 to 50.5 over a year — suggests that if there are no major macroeconomic shocks, 2026 may be a consolidation year rather than another round of real wage erosion.
Benchmark Your Own Salary
This dataset gets more accurate every time someone contributes a data point. If you found this analysis useful, the most direct thing you can do is add your own salary report to WorthMap — it takes two minutes and it goes directly into the next version of this benchmark.
WorthMap is a community resource built by and for designers in Egypt and the wider Middle East. The data is anonymous, verified, and freely accessible. If you're trying to understand where your compensation sits relative to your peers — or preparing for a salary conversation — the live benchmark is the most current data available.